Introducing CO2 Emissions Tracking
On behalf of CargoTrans, we’re excited to announce the launch of our new CO2 Emissions Tracking solution, available today for all of our clients. Designed with environmental accountability at its core, our CO2 emissions tracking platform gives importers and exporters full visibility into the carbon footprint of every shipment — regardless of mode. As global regulators, investors, and customers raise the bar on environmental, social, and governance (ESG) reporting, having accurate emissions data is no longer optional. It is a business imperative.
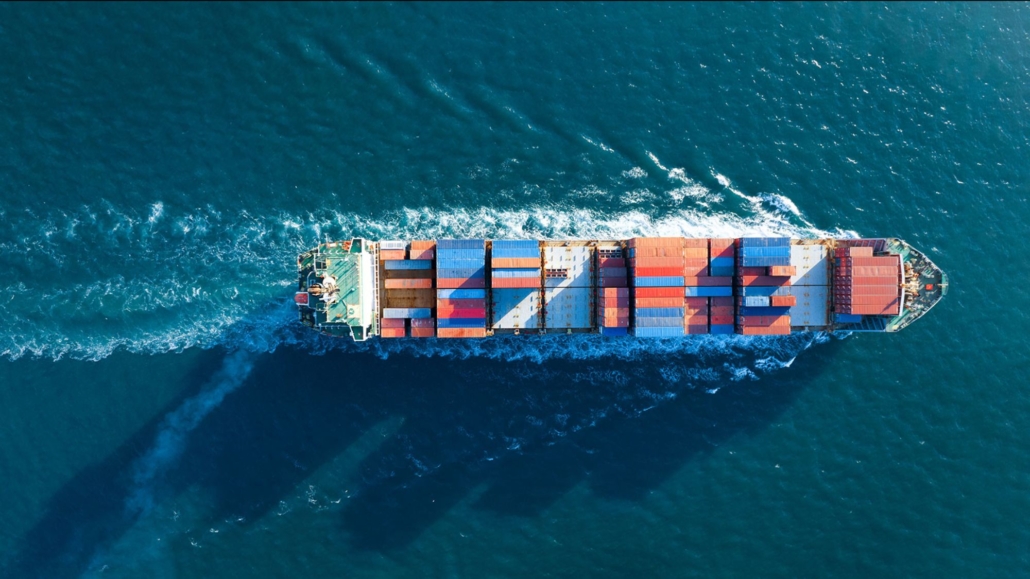
Whether you move cargo by ocean, air, or truck, understanding the carbon impact of your supply chain starts with measurement. Our new tool integrates directly with our supply chain visibility software so that emissions data flows alongside your shipment milestones — giving your logistics and sustainability teams a single source of truth.
Quantify your exposure in 20 minutes
Our trade strategists run your last 90 days of entries through Captain to surface refund eligibility, Section 232 traps and PNTR risk.
Why CO2 Emissions Tracking Matters for Modern Supply Chains
Global freight is responsible for a significant share of worldwide greenhouse gas emissions. Ocean shipping alone accounts for roughly 2.5% of global CO2 output, according to the International Maritime Organization (IMO), while air freight carries a substantially higher emissions intensity per ton-mile. As supply chains have grown more complex and extended across multiple continents, the cumulative carbon impact has grown with them.
For companies facing regulatory pressure, investor scrutiny, or customer sustainability requirements, reliable emissions data is the foundation of any credible decarbonization strategy. Here is why tracking CO2 at the shipment level is essential:
- Regulatory compliance: The European Union’s Carbon Border Adjustment Mechanism (CBAM) and SEC climate disclosure rules in the US are driving demand for granular, auditable emissions data.
- Customer requirements: Large retailers and manufacturers increasingly require suppliers to report Scope 3 emissions, which include logistics and transportation.
- Operational efficiency: Identifying the highest-emitting lanes and modes reveals opportunities to consolidate shipments, shift modes, or optimize routing.
- Brand differentiation: Companies that can demonstrate measurable emissions reductions gain a genuine competitive edge with ESG-focused buyers and partners.
- Risk management: Carbon-intensive supply chains face increasing exposure to carbon taxes, fuel surcharges, and port emissions fees as environmental regulation tightens globally.
Capabilities of Our CO2 Emissions Tracking Software
Our emissions tracking solution was built to integrate seamlessly into your existing logistics workflow. Rather than requiring a separate platform or manual data entry, it draws on real shipment data — actual routes, vessel types, aircraft types, and load factors — to produce accurate, methodology-aligned emission estimates. Below is an overview of what the platform delivers.
Shipment-Level Carbon Measurement
Every shipment processed through CargoTrans is now assigned a calculated CO2 equivalent (CO2e) figure based on the actual mode of transport, origin and destination, carrier, and cargo weight. Our methodology aligns with IATA carbon accounting standards for air freight and the IMO’s CII framework for ocean freight, giving you defensible, internationally recognized figures.
Key measurement capabilities include:
- Ocean freight emissions: Calculated per TEU-mile using vessel type, engine class, and voyage route data.
- Air freight emissions: Computed per kilogram using aircraft type, belly vs. freighter capacity, and actual flight routing.
- Ground transport emissions: Estimated per mile based on truck type and payload, covering drayage and inland delivery legs.
- Multimodal shipments: Combined CO2e for full door-to-door moves covering multiple transport modes in sequence.
Analytics Dashboard and Reporting
Raw emissions data is only useful when it can be analyzed, aggregated, and shared. Our emissions analytics dashboard — built into the same Control Tower platform you already use to manage your shipments — provides actionable insights at multiple levels of your organization.
- Aggregate CO2e by lane, carrier, time period, or business unit
- Year-over-year and month-over-month emissions trend charts
- Mode-by-mode breakdown showing where emissions intensity is highest
- Exportable reports in CSV and PDF formats for ESG disclosures
- Custom dashboards for sustainability teams, procurement, and executive leadership
Emissions Impact Analysis and Benchmarking
Understanding your carbon footprint is the first step — understanding how to reduce it is where the real value lies. Our emissions impact analysis tools allow you to model alternative scenarios before you book, so your team can make smarter decisions from the outset. For example, you can compare the CO2e cost of air freight versus expedited ocean freight for a given lane, or evaluate the emissions impact of freight consolidation versus multiple partial shipments.
Benchmarking features let you compare your emissions performance against industry averages by trade lane, helping you identify which routes and carriers offer the best combination of cost, transit time, and environmental performance. This directly supports your supply chain risk management framework by surfacing both financial and environmental exposure across your network.
How CO2 Tracking Integrates With Your Broader Supply Chain Strategy
Emissions tracking does not exist in isolation. The most effective sustainability programs connect carbon data directly to procurement, routing, and carrier selection decisions. CargoTrans has built this integration into the core of our platform so that your sustainability goals are embedded in your daily operational workflows — not siloed in a separate reporting tool that gets updated quarterly.
Connecting Emissions Data to Carrier Selection
Not all carriers and routes carry the same emissions profile. Modern vessels built to IMO Tier III standards emit substantially less CO2 per TEU than older tonnage. Similarly, some airlines operate newer-generation aircraft with significantly better fuel efficiency. Our platform surfaces this data at the point of booking, enabling your team to factor environmental performance into carrier selection decisions alongside cost and transit time.
For shippers who want to track ocean, air, and land freight across a unified dashboard, this capability means your emissions data stays current and complete across all modes without any additional manual work.
Supporting Scope 3 ESG Reporting
Logistics and transportation are typically categorized under Scope 3 Category 4 (upstream transportation and distribution) in the GHG Protocol framework. For many manufacturers and retailers, Scope 3 emissions can account for 70% or more of their total carbon footprint — and freight is often the largest single contributor within that category.
Our CO2 tracking platform generates the auditable, shipment-level records that your sustainability, finance, and legal teams need to complete annual ESG disclosures. Data can be exported in formats aligned with common reporting frameworks, and our trade advisory services team can assist with the interpretation and contextualization of your emissions data within specific regulatory frameworks.
Setting and Tracking Reduction Targets
Once you have a baseline, you can set meaningful reduction targets. Our platform supports goal-setting workflows that allow your team to:
- Establish a baseline year and total CO2e for your freight operations
- Set annual reduction targets as a percentage of baseline
- Monitor progress toward targets in real time as shipment data flows in
- Identify specific lanes or modes where reductions are ahead of or behind target
- Generate interim progress reports for internal stakeholders and external auditors
Practical Steps to Reduce Your Freight Carbon Footprint
Understanding your emissions baseline is only the beginning. The data our platform provides should translate into concrete operational changes that reduce CO2 output over time. Here are the most impactful levers that importers and exporters can pull:
- Shift from air to ocean: Air vs. ocean freight comparison shows that ocean shipping produces roughly 30 to 50 times less CO2 per kilogram of cargo than air transport for equivalent lanes. Where lead time allows, mode shifting is the single highest-impact change most companies can make.
- Consolidate shipments: Partial loads and frequent small shipments dramatically increase emissions intensity per unit. Our freight consolidation guide details how LCL and FCL strategies affect both cost and carbon.
- Optimize routing: Longer routings via Cape of Good Hope or transoceanic transshipment hubs add both transit time and emissions. Our platform can identify when direct services reduce your CO2 footprint alongside transit time.
- Select lower-emission carriers: Within any given mode, significant variation exists in emissions intensity between carriers. Prioritizing vessels and aircraft with modern, fuel-efficient engines reduces your Scope 3 footprint without changing your operational model.
- Address supply chain challenges proactively: Reactive logistics — expedited air shipments, rush transloading, emergency re-routing — carries both a cost and carbon premium. Addressing supply chain challenges upstream reduces both financial and environmental waste.
Getting Started With CO2 Emissions Tracking
Our CO2 Emissions Tracking feature is available to all CargoTrans clients effective immediately. Existing users of our supply chain visibility software will find emissions data automatically populated for new shipments without any additional configuration required. Historical emissions estimates for previous shipments can be generated on request for clients who need to establish a baseline for prior reporting periods.
We believe that every step toward sustainability matters — and that the freight industry has both the tools and the responsibility to make measurable progress. This launch underscores our ongoing commitment to environmental stewardship, and it is the first in a series of sustainability-focused features we will be releasing throughout the year.
To learn more about our CO2 Emissions Tracking capabilities, or to discuss how your organization can incorporate emissions data into your ESG reporting and logistics strategy, contact CargoTrans today. Our team is ready to walk you through the platform and help you establish your first emissions baseline.


