Gain full visibility of your end to end supply chain
Modern shippers and their customers need one place to see, manage, and optimize every step of the end to end supply chain process, from sourcing to final delivery and reverse logistics. A digital Control Tower platform like Captain unifies this view across air, ocean, and land, turning fragmented data into actionable insight for small and mid-sized businesses. Without this unified view, teams work in silos — procurement doesn’t know what logistics knows, and logistics doesn’t know what customs knows — leading to delays, excess costs, and preventable service failures.
The companies winning in today’s complex trade environment are those that have replaced disconnected spreadsheets and carrier portals with a single, always-on operational view. This guide explains what an end to end supply chain looks like, why visibility is the most critical enabling capability, and how a Control Tower dashboard transforms fragmented processes into a managed, competitive workflow.
Quantify your exposure in 20 minutes
Our trade strategists run your last 90 days of entries through Captain to surface refund eligibility, Section 232 traps and PNTR risk.
What Is an End to End Supply Chain Process?
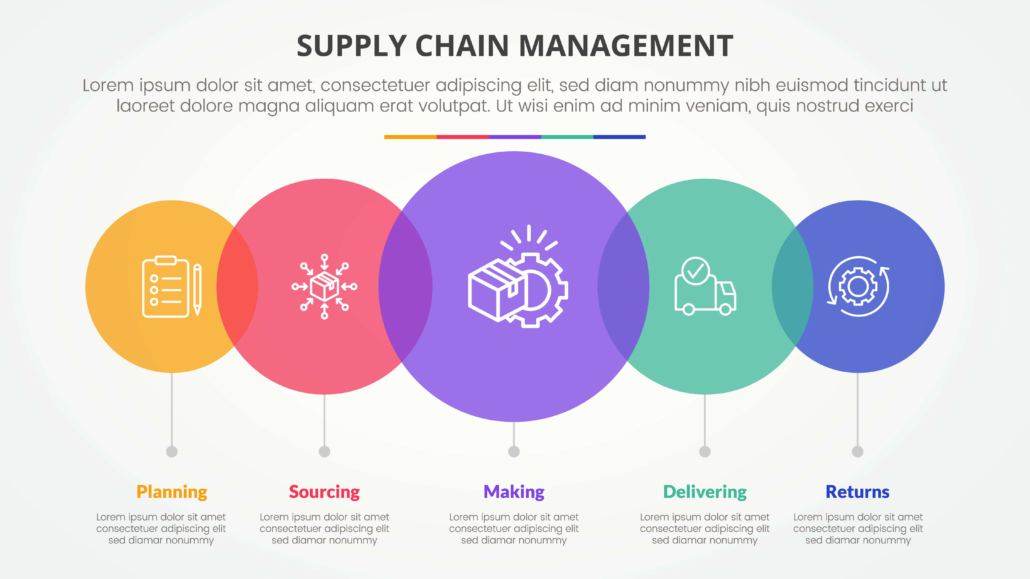
An end to end supply chain process covers every activity from demand planning and sourcing through production, warehousing, transportation, delivery, and after-sales service. It connects these stages with shared data and workflows so all stakeholders can collaborate instead of working in isolated systems. For shippers, this means seeing how a sourcing delay impacts production schedules, freight bookings, customs clearance, and final delivery — all in one continuous, unbroken flow of information.
The end to end approach matters because supply chains are only as strong as their weakest handoff. When one stage operates without visibility into the others, small problems compound into significant disruptions before anyone has a chance to intervene. A truly integrated end to end process eliminates those blind spots and replaces reactive firefighting with proactive management.
Key Stages in the End to End Supply Chain Process Flow
Understanding the full scope of an end to end supply chain helps businesses identify where visibility gaps exist and where the most significant operational risks tend to concentrate. Each stage creates data that, when shared across the chain, enables better decisions everywhere else.
- Demand planning and product design — Forecasting demand, defining SKUs, establishing service levels, and aligning production capacity with market expectations.
- End to end sourcing process — Supplier selection, contracting, purchase order management, and tracking supplier performance against agreed timelines.
- Manufacturing and production — Conversion of inputs to finished goods, capacity planning, quality checks, and readiness-to-ship confirmation.
- Warehousing and inventory management — Storage, picking, packing, and maintaining appropriate safety stock levels without tying up excess working capital.
- Logistics end to end process — Inbound and outbound transport, multimodal freight forwarding, customs filings, and carrier management across ocean, air vs. ocean freight, and land modes.
- Delivery and last mile — Distribution center operations, appointment scheduling, proof-of-delivery capture, and customer notifications at every milestone.
- Reverse logistics and after-sales — Returns processing, repairs, warranty claims, and customer support that feeds back into inventory and demand planning.
Why Visibility Matters in End to End Supply Chain Management
End to end supply chain management aims to orchestrate all these stages with a single version of the truth, replacing disconnected spreadsheets and email threads with shared, real-time data. When visibility is limited, the consequences cascade quickly: stockouts damage customer relationships, excess inventory consumes capital, missed ETAs trigger chargebacks, and incomplete shipments create disputes that take weeks to resolve. The cost of poor visibility is rarely measured in a single line item — it shows up everywhere, and it compounds.
Core Benefits of End to End Visibility
Shippers who invest in end to end visibility consistently report improvements across four dimensions that matter most to their operations and their customers:
- Faster, more accurate decisions — React to exceptions in minutes rather than days, before small delays become missed commitments.
- Lower logistics and inventory costs — Optimize transport modes, consolidate shipments using a smart freight consolidation guide, and reduce safety stock by replacing uncertainty with real data.
- Improved on-time delivery and customer experience — Proactive communication about delays and milestone completions builds trust and reduces inbound inquiry volume.
- Stronger supplier and carrier collaboration — Shared data, shared SLAs, and shared KPIs replace adversarial relationships with aligned incentives and mutual accountability.
From Fragmented Systems to a Control Tower Dashboard
Most growing shippers use a mix of ERP systems, WMS platforms, TMS applications, carrier portals, and spreadsheets, making the end to end supply chain process nearly impossible to see in one coherent view. Each system holds a piece of the picture, but no one tool connects them all. A Control Tower dashboard acts as the single pane of glass that aggregates data from all these systems into a real-time, actionable operational view — one that every stakeholder can access without switching between tools or waiting for manual status updates.
Why a Control Tower Dashboard Is Critical for E2E Logistics
The value of a Control Tower lies not just in consolidating data, but in making that data actionable for the people who need to respond when things change — which in global logistics, is constantly.
- Combines track ocean, air, and land freight data in a single, configurable dashboard view.
- Shows the full end to end supply chain process flow with current status by shipment, purchase order, SKU, or customer account.
- Highlights exceptions — delays, customs holds, failed milestones — and enables corrective actions before they escalate.
- Supports collaboration by giving internal teams, carriers, and customers access to the same live operational information.
- Provides a complete audit trail of events, communications, and decisions for every shipment in the system.
Mapping the End to End Sourcing Process with a Control Tower
The end to end sourcing process spans supplier selection, purchase orders, production updates, and inbound logistics right up until goods are received in your warehouse. When procurement and logistics teams operate from different data sources, sourcing delays routinely turn into missed launch dates or promotional windows. A Control Tower dashboard centralizes all sourcing milestones so both teams act on the same, current information.
Typical Sourcing Milestones to Track
A robust end to end sourcing visibility model should capture events at every handoff point between supplier, forwarder, and importer:
- PO creation, supplier confirmation, and any subsequent revisions or line-item changes.
- Production start date, in-process status updates, and confirmed ready-to-ship dates from the factory.
- Freight booking with forwarder, including mode selection, carrier assignment, routing, and Incoterms confirmation.
- Factory gate moves, port cut-off deadlines, and customs document readiness checks.
- Vessel or flight departures, transshipment events, ETA updates, and estimated time of arrival to port and warehouse.
With these events visible in one dashboard, shippers can immediately identify which purchase orders risk missing launch dates or promotions and adjust production schedules, inventory allocations, or transport modes accordingly — before it is too late to act.
Logistics End to End Process: How Captain Supports Air, Ocean, and Land
For many SMB shippers, logistics performance is where customer promises are won or lost. CargoTrans provides freight forwarding across ocean, air, rail, and road, while Captain brings all those shipments into a unified, client-facing supply chain visibility software platform. The combination means shippers get operational execution and real-time intelligence from one partner, without having to reconcile data from multiple systems.
Key Logistics Flows Covered
- Inbound logistics — From supplier facilities to ports and distribution warehouses, with full visibility at every handoff.
- International freight — FCL and LCL ocean, air freight, intermodal rail, and multimodal combinations optimized for cost and transit time.
- Domestic distribution — Truckload, LTL, and last-mile shipments from distribution centers to customers, retail locations, or fulfillment partners.
- Customs and compliance events — Holds, inspections, document status updates, duty calculations, and customs consulting support integrated into the same operational view.
How a Control Tower Dashboard Enhances End to End Supply Chain Management
A modern Control Tower dashboard does not just display data — it turns the end to end supply chain process into a managed, measurable workflow. Captain is designed specifically as a client-facing visibility platform for shippers and their customers, offering real-time updates, proactive alerts, and exception management tools that keep operations moving even when disruptions occur. The platform is built for the operational reality of small and mid-sized businesses, where teams are lean and every hour of delay has a disproportionate impact on service levels and margins.
Core Capabilities of Captain’s Control Tower Dashboard
- Real-time shipment tracking and milestone visibility across global air, ocean, and land transport modes.
- Centralized view of inventory levels, open orders, and customs status from procurement through final delivery.
- Configurable widgets and reports so each user sees the KPIs and workflow views most relevant to their role.
- Integrated communication tools, so comments and documents are attached to shipment records rather than buried in scattered email threads.
- Historical performance analytics for benchmarking carriers, suppliers, and trade lanes over time.
Proactive Exception Management
Exception management is where the real operational value of a Control Tower is realized. Automated alerting means teams spend their time resolving issues rather than searching for them:
- Automated alerts when shipments deviate from plan — missed port cut-offs, rolled cargo, customs holds, or carrier schedule changes.
- Prioritized exception queues so teams tackle the highest-impact issues — by shipment value or ETA urgency — first.
- Root-cause visibility that distinguishes supplier delays from carrier issues from documentation failures, enabling targeted corrective actions rather than generic follow-up.
Supply Chain Risk and Tariff Compliance in the End to End View
End to end supply chain management today must account for trade policy risk alongside operational logistics risk. Supply chain risk management has expanded to include tariff exposure, sanctions screening, origin compliance, and customs documentation accuracy — all of which can halt a shipment just as effectively as a missed vessel cut-off. Captain’s Control Tower integrates these compliance checkpoints directly into the operational shipment view, so shippers see both where their cargo is and whether it is moving through regulatory requirements without issues.
For businesses navigating Section 301 tariffs or managing the complexity of the de minimis rule changes, having compliance status visible alongside operational status eliminates the gaps where duty exposure and customs holds tend to emerge. When trade advisory intelligence and shipment tracking live on the same platform, shippers can make integrated decisions — adjusting routes, modes, or sourcing in response to both operational and regulatory developments simultaneously.
Stay Compliant and Operationally Sharp
An end to end supply chain that is visible, connected, and proactively managed is not just an operational advantage — it is a competitive differentiator. Businesses that can see across every stage, respond to exceptions in minutes, and integrate compliance into their operational workflow are positioned to outperform peers in both cost efficiency and customer service. Captain’s Control Tower dashboard is purpose-built to deliver exactly that capability for growing shippers who need enterprise-grade visibility without enterprise-grade complexity.
Control Tower keeps your shipments moving compliantly amid evolving trade rules. Access your dashboard today and see your entire supply chain in one place.


