Role of Analytics in Supply Chain Management
Analytics transforms scattered shipment data into actionable insights, enabling shippers to optimize freight costs, predict delays, and improve on-time delivery across air, ocean, and land. The role of analytics in supply chain management has evolved dramatically in recent years—from static historical reporting to real-time, predictive intelligence that directly shapes operational decisions.
For small and mid-sized shippers, this evolution represents a significant opportunity. What was once the exclusive domain of enterprise logistics teams with dedicated data science capabilities is now accessible through Control Tower platform technology delivered as part of a comprehensive freight forwarding service. CargoTrans delivers this through real-time visibility, exception alerts, and performance analytics—all in one client-facing platform built specifically for the needs of growing importers and exporters.
Quantify your exposure in 20 minutes
Our trade strategists run your last 90 days of entries through Captain to surface refund eligibility, Section 232 traps and PNTR risk.
Why Analytics Is Essential for Freight Forwarders’ Clients
The case for analytics in supply chain management is not abstract. Every day that a business operates without clear data on shipment performance, carrier reliability, and landed cost variance is a day it is making decisions based on incomplete information—and paying for it in delays, unexpected charges, and missed optimization opportunities.
The Evolution from Reporting to Intelligence
Traditional supply chain analytics focused almost exclusively on historical reporting: what happened last month, which carriers were late, what the total freight spend was for the quarter. This backward-looking approach is better than nothing, but it is not enough for today’s dynamic trade environment shaped by supply chain challenges ranging from port congestion to tariff volatility.
Modern analytics tools emphasize predictive and prescriptive insights that inform operational decisions before problems occur:
- Predictive analytics tell you a shipment is likely to be delayed three days before the carrier reports it, based on historical lane data and current port conditions
- Prescriptive analytics recommend that you switch to air freight for a specific high-value order because the ocean route risk profile has shifted
- Exception-based analytics surface the 10% of shipments causing 80% of your operational problems, so your team focuses where it matters
For shippers using multiple carriers and freight modes, a supply chain visibility software platform aggregates data from TMS, carriers, and customs systems into unified KPIs like OTIF (on-time in-full), carrier scorecards, and lane efficiency metrics. Unlike broad enterprise platforms that require extensive configuration and IT support, CargoTrans focuses on what mid-sized importers actually need: shipment-level analytics without the IT overhead.
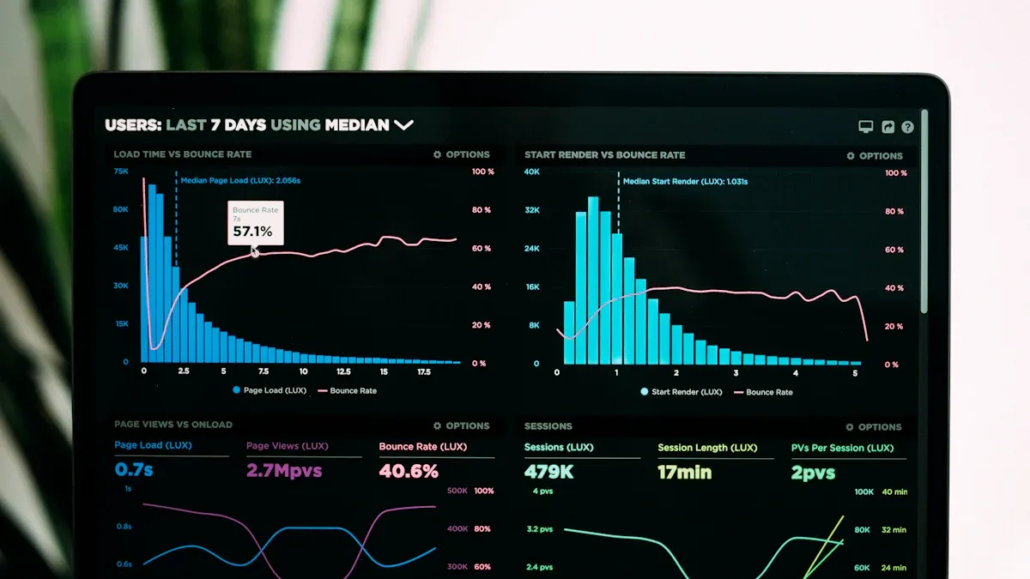
Core Analytics Types in Control Tower Dashboards
A well-designed Control Tower analytics framework operates across four distinct layers, each providing a different type of intelligence and supporting different types of decisions.
The Four Levels of Supply Chain Analytics
Understanding these four analytics tiers helps shippers appreciate what they are getting—and what they should expect—from a modern Control Tower platform:
- Descriptive Analytics: The foundation layer. Answers the question “what is happening right now?” This includes current status of all shipments, inventory positions, ETAs by carrier and lane, and total freight spend to date. Descriptive analytics are the starting point—essential, but not sufficient on their own.
- Diagnostic Analytics: Answers the question “why did this happen?” Root cause analysis of delays, identification of which lanes consistently underperform, correlation between specific carrier usage and on-time delivery rates. Diagnostic analytics turn observations into understanding. For example, discovering that 60% of your ocean container delays from a specific origin port are concentrated in one carrier helps you make a better carrier selection decision on your next booking.
- Predictive Analytics: Answers the question “what is likely to happen?” Delay forecasts using historical data, current weather patterns, carrier trends, and port congestion indicators. Predictive analytics give your team the lead time needed to take preventive action rather than reactive damage control. When your Control Tower predicts a 4-day delay on an inbound shipment, you can alert your warehouse, adjust a customer delivery commitment, or expedite a portion of the order via air vs. ocean freight alternatives.
- Prescriptive Analytics: The highest-value tier. Answers “what should we do?” Recommended re-routes when a primary lane becomes congested, carrier switch suggestions when a booking is at risk, and consolidation opportunities when multiple smaller shipments can be combined. See our freight consolidation guide for how prescriptive insights drive consolidation decisions.
How Control Tower Analytics Outperforms Spreadsheets
Many mid-sized shippers still rely on manually maintained spreadsheets to track shipments and analyze logistics performance. This approach is not just inefficient—it actively creates risk by introducing data lag, human error, and analytical gaps that a real-time platform eliminates entirely.
Key Capabilities That Spreadsheets Cannot Match
CargoTrans integrates analytics directly into freight forwarding workflows through capabilities that no spreadsheet can replicate:
- Multi-modal visibility in one dashboard: Track air, ocean, and land freight simultaneously with live carrier API connections. You can track ocean, air, and land freight across all active shipments without switching systems or manually entering tracking numbers.
- Exception-based analytics: Intelligent filtering surfaces high-impact issues automatically—the 10% of shipments causing 80% of delays—without requiring manual review of every row in a spreadsheet. Your team works exceptions, not data.
- Custom KPI dashboards: Tailor views for different stakeholders: finance teams see landed costs and duty accruals; operations teams see on-time delivery rates and carrier scorecards; sales teams see customer-facing ETA commitments. Each user gets the analytics that matter for their role.
- Unified data without silos: ERP, TMS, and WMS data integrated into a single analytics layer—no manual data exports, no version control problems, no reconciliation between systems. This integration is particularly valuable for managing customs clearance documentation alongside shipment tracking data.
- Tariff and cost analytics: Integration with our tariff calculator means landed cost analytics include duty projections alongside freight costs—giving you a true total cost view rather than freight-only numbers that miss a major cost component.
For small and mid-sized shippers, this means enterprise-grade analytics delivered through your forwarder—without purchasing, implementing, or maintaining new software.
Overcoming Common Analytics Challenges in Supply Chain Management
Even with the right tools, implementing effective analytics requires addressing several common barriers that plague logistics operations. Data silos, poor data quality, and legacy systems are cited as major challenges by a significant portion of supply chain operations. A well-designed Control Tower addresses these barriers systematically.
How Control Tower Solves the Analytics Barrier Problem
The most frequent obstacles to effective supply chain analytics—and how the Captain Control Tower overcomes them:
- Data silos across carriers and systems: Pre-built integrations with common TMS, ERP, and carrier platforms eliminate manual data aggregation. Instead of waiting for carriers to send status reports, Captain pulls live data from carrier APIs and normalizes it into a consistent format across all freight modes and providers.
- Data quality and consistency issues: Real-time cleansing and validation flags inconsistencies—such as mismatched ETAs between carrier reports and vessel tracking data—before they propagate into your analytics. Bad data in, bad decisions out; the Control Tower breaks that cycle.
- Complexity and resource requirements: Scalable for SMBs without requiring data scientists or dedicated analytics staff. Intuitive dashboards present actionable insights in plain language, not technical metrics that require specialist interpretation.
- Tariff data integration: Most logistics analytics platforms treat tariff costs as an afterthought. Captain integrates duty and tariff data from day one, so your landed cost analytics reflect the full picture. This is particularly important when managing shipments subject to Section 301 tariffs or Section 232 tariffs, where duty costs can represent 25%+ of total landed cost.
- Risk visibility gaps: Effective supply chain risk management requires analytics that surface not just current problems but emerging risks. Captain’s exception alerts and predictive models provide this forward-looking risk view across your entire active shipment portfolio.
The recommended approach for shippers new to Control Tower analytics: start with descriptive views to establish baseline visibility, then progressively adopt diagnostic and predictive capabilities as data accumulates and your team builds analytical confidence.
The Business Impact of Better Supply Chain Analytics
The tangible business outcomes of effective supply chain analytics extend well beyond logistics operations. When analytics drive better decisions across freight, customs, and tariff management, the impact ripples through the entire organization.
Measurable Outcomes Across Business Functions
Consider the cross-functional impact of moving from reactive, spreadsheet-based logistics management to a data-driven Control Tower approach:
- Finance: Accurate landed cost projections improve purchase order economics, reduce duty surprise accruals, and enable better pricing decisions. Working with trade advisory services alongside analytics data can identify duty classification opportunities that reduce your effective tariff rate.
- Operations: Proactive delay alerts enable pre-arranged inland transportation, eliminating demurrage and detention charges that would otherwise accumulate. Better carrier performance data drives smarter booking decisions on future shipments.
- Sales and customer service: Reliable, analytics-driven ETAs give sales teams accurate delivery commitments to share with customers. Fewer surprises means fewer escalations and stronger customer relationships.
- Procurement and sourcing: Historical analytics on carrier performance, lane reliability, and total cost by origin country inform sourcing strategy decisions—including whether to pursue retaliatory tariff exposure reduction through supplier diversification.
- Compliance: Analytics-driven documentation management and customs data integration reduces the risk of compliance failures. For complex customs consulting needs, having analytics that document your historical compliance record strengthens your position with customs authorities.
Get Started with Supply Chain Analytics
If you are ready to take control of your supply chain through the power of analytics, Captain’s end-to-end visibility software is the right solution. Our system is designed to help businesses track, manage, and optimize every stage of their supply chain process—from origin booking through final delivery—ensuring maximum efficiency, reduced risk, and improved customer satisfaction.
The Captain Control Tower combines real-time shipment analytics, tariff intelligence, exception management, and carrier performance data into a single platform. It is not a standalone software subscription; it is integrated into the CargoTrans freight forwarding service, which means you get access to enterprise-grade analytics without enterprise-level implementation costs.
Contact us today to schedule a demonstration or learn more about how Captain can transform your supply chain analytics capabilities and deliver the operational intelligence your business needs to compete effectively in global trade.


