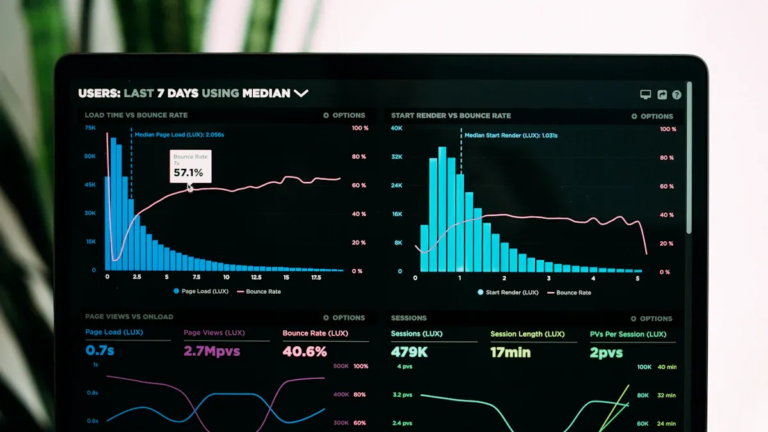
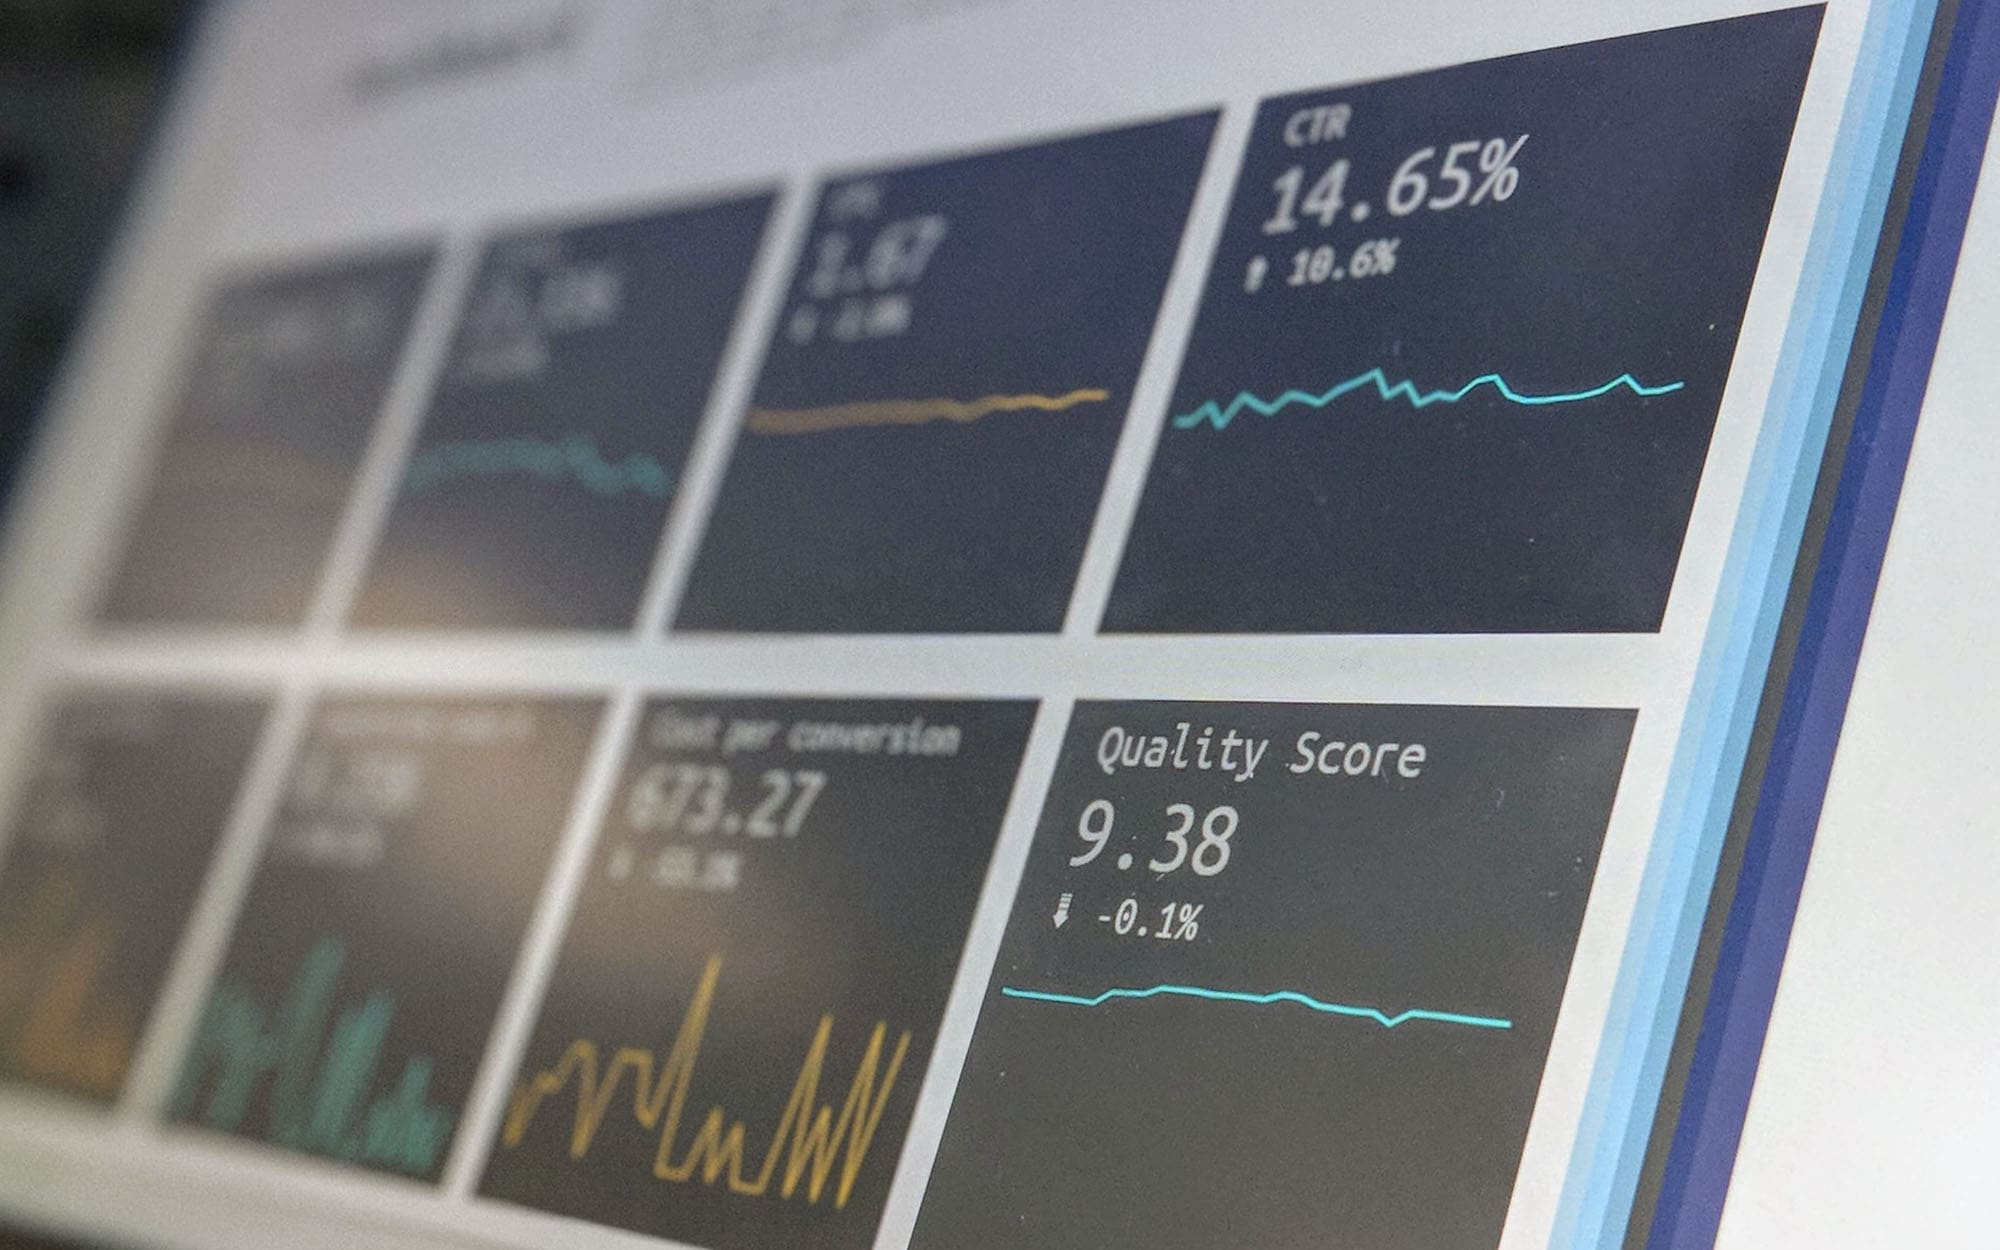
Atlas TMS turns the shipment and cost data you already capture into freight spend analytics, KPI dashboards, and lane and carrier scorecards, so decisions run on numbers instead of gut —
spend visibility, custom reports, and open data export from one platform you license and control.
Freight analytics software takes the shipment, cost, and status data a transportation platform captures and turns it into answers: what you spend by lane and carrier, where cost is drifting, which carriers hit their windows, and which reports finance and operations actually need every week.
Atlas TMS builds analytics on data it already holds, so freight spend, accessorials, transit times, and on-time performance roll up automatically instead of being rebuilt in a spreadsheet each month. Because the same platform tracks your loads, on-time metrics are grounded in real TMS shipment tracking software events rather than carrier claims.
The value is one source of truth for freight performance instead of exports stitched together by hand. Dashboards answer standing questions at a glance, a report builder handles the one-off ask, and open export feeds your BI stack, so importers who need broader planning can pair it with our supply chain optimization software for network-level modeling. The same dashboards read cost and service straight from the loads your carrier management software scores, so carrier performance and freight spend line up in one view.
99.2%
Spend captured
< 90s
Dashboard refresh
24h
Response time
Free Product Demo
Talk to a TMS Specialist
A 30-minute walkthrough of the analytics module against your freight data. No obligation.
We reply within 1 business day · Your data stays private.
Capabilities
Atlas TMS Freight Analytics Capabilities
Six capabilities the analytics module gives your team so freight spend, performance, and reporting run on one trustworthy dataset instead of scattered exports.
01
Freight Spend Analytics
Total landed freight cost sliced by lane, mode, carrier, and business unit in one view.
Spend by lane, mode, and carrier
Accessorial and surcharge breakdowns
Cost-per-unit and cost-per-pound trends
Budget-versus-actual variance tracking
02
KPI Dashboards
Standing dashboards answer the questions operations and finance ask every week.
On-time pickup and delivery rates
Transit time by lane and mode
Role-based dashboard views
03
Lane Performance Analytics
Every lane scored on cost, transit, and reliability so problem lanes surface fast.
Cost and transit trends per lane
Volume and seasonality patterns
Underperforming-lane flags
04
Carrier Performance Scorecards
Objective scorecards rank carriers on the metrics that decide who earns your freight.
On-time and tender acceptance rates
Claims and exception frequency
Cost competitiveness by lane
05
Custom Report Builder
Build the one-off report finance asks for without waiting on IT or an analyst.
Drag-and-drop fields and filters
Saved and scheduled report delivery
Shareable links and PDF output
06
Data Export and Sharing
Open export feeds your BI tools and finance systems with clean freight data.
Analytics run on the same data the platform uses to tender, rate, and track freight, so your dashboards and your operations never disagree the way separate exports always do.
On-time and transit metrics are built from real tracking events, not carrier self-reporting, so carrier scorecards reflect what actually happened rather than what a carrier claims.
A self-service report builder means finance gets the one-off cut it needs without a ticket to IT, so answers arrive in minutes rather than at the end of a month-close scramble.
Open export and an API keep your data yours, so analytics feed your BI stack and finance systems instead of locking numbers inside a tool you cannot get data out of.
Onboarding
How Atlas TMS Freight Analytics Onboarding Works
01
Connect Data Sources
Bring in shipment, cost, and status data from Atlas TMS and any external feeds.
02
Map Cost and Reference Fields
Align accessorials, business units, and lane codes so numbers roll up cleanly.
03
Configure Dashboards and KPIs
Set the metrics, thresholds, and role-based views your teams need.
04
Go Live with Reporting
Publish dashboards and hand teams the self-service report builder.
05
Optimize and Schedule Reports
Automate recurring reports and refine metrics against how teams use them.
Freight data should not sit trapped in a dozen exports that never agree. With spend analytics, KPI dashboards, and a report builder on one dataset, performance becomes a number your team can defend and act on.
Atlas TMS turns raw shipment records into decisions your operations and finance teams share.
Free 30-minute product demo against your real freight data
No-obligation review of your current reporting and its blind spots
Guided connection of your shipment, cost, and status sources
Dashboards and scorecards configured to your lanes and carriers
An Atlas TMS specialist will map your spend and show live dashboards on your own data.
Protected by reCAPTCHA. We respond within 1 business day. No spam, ever.
Integrations
Freight Analytics That Pulls From Every System
The analytics module reads directly from Atlas TMS shipment, rate, and tracking data, and it ingests external feeds through the API and file import, so freight bills, accessorials, and ERP cost centers all roll into one dataset instead of separate spreadsheets.
Outbound, clean freight data flows to your BI warehouse and finance systems through scheduled exports and the API, so the numbers your executives see in their own tools are the same numbers the operations team sees on the floor.
Freight Analytics Data Kept Secure and Access-Controlled
Analytics data is encrypted in transit and at rest, and role-based access controls decide who sees which dashboards, business units, and cost data, so a lane manager sees their region while finance sees the full spend picture.
Access is logged, single sign-on is supported, and the platform runs in audited, access-restricted infrastructure, so sensitive freight cost and rate data stays inside a controlled, reviewable boundary rather than living in emailed spreadsheets.
Freight analytics software is the reporting layer inside a transportation platform that turns raw shipment and cost data into answers about spend and performance. Instead of exporting records and rebuilding a spreadsheet each month, you get dashboards that show freight spend by lane and carrier, transit and on-time trends, accessorial breakdowns, and carrier scorecards, all refreshed automatically. Atlas TMS builds this on data it already captures while tendering, rating, and tracking your freight, so the numbers stay consistent with operations. A self-service report builder handles one-off questions, and open export feeds your BI stack. The goal is one source of truth for freight performance that finance and operations both trust, rather than a stack of conflicting exports that take days to reconcile and are stale by the time anyone reads them.
What freight KPIs does it track?
Out of the box, the module tracks the metrics that decide freight cost and service: total freight spend by lane, mode, carrier, and business unit; cost per unit, per pound, and per shipment; accessorial and surcharge share of spend; on-time pickup and delivery rates; transit time by lane; tender acceptance rates; and claims and exception frequency. Carrier scorecards combine several of these into an objective ranking, and lane analytics flag routes drifting on cost or reliability. Because you can also build custom reports, you are not limited to the standard set; if your team measures something specific, you can add it as a metric or a report. The standard KPIs cover the questions most operations and finance teams ask weekly, and the builder covers the rest.
Where does the freight data come from?
The primary source is Atlas TMS itself, which already holds your shipment records, rates, accessorials, and tracking events from tendering and moving freight. The module reads that data directly, so there is no separate data-entry step. On top of that, it ingests external sources through the API and file import: freight invoices, ERP cost centers, and data from carriers or other systems you want reflected in the numbers. During onboarding we map cost and reference fields so accessorials, business units, and lane codes roll up cleanly into one dataset. Because analytics sit on the operational data rather than a manual copy, dashboards stay in step with what actually happened, which is the difference between analytics you trust and a spreadsheet that is out of date the moment it is built.
How fresh is the dashboard data?
Dashboards refresh against live platform data, typically within about ninety seconds of the underlying event, so an on-time rate or a spend figure reflects what happened today rather than last week. Because the analytics module reads from the same database that records tenders, rates, and tracking events, there is no overnight batch delay for platform-native metrics. Data imported from external sources like freight invoices refreshes on the schedule of that feed, which we set during onboarding. The platform shows the timestamp of the last refresh so your team always knows how current a number is. The design goal is that a manager can open a dashboard in a meeting and trust it is current, rather than wondering whether they are looking at a snapshot from the previous close.
Can I build my own custom reports?
Yes. The custom report builder lets your team assemble the exact report finance or operations asks for without a ticket to IT or a wait on an analyst. You choose fields, apply filters, group and sort, and save the report to run again or schedule for automatic delivery. Reports can be shared by link or exported to PDF, CSV, or Excel. Because the builder sits on the full freight dataset, you are not limited to preset templates; if the question is answerable from your shipment and cost data, you can build the report yourself. This matters most during month close and budget reviews, when a specific cut is needed quickly. Self-service reporting turns a multi-day request into a few minutes of work for the person who actually needs the answer.
How does it analyze freight spend?
Freight spend analytics break total transportation cost into dimensions you can act on: spend by lane, mode, carrier, and business unit, plus accessorial and surcharge detail that usually hides the first savings opportunities. Cost-per-unit and cost-per-pound trends show whether you are getting more or less efficient over time, and budget-versus-actual variance tracking flags where spend is drifting from plan. Because the data is granular, you can drill from a total down to the specific lane or accessorial driving a change. Seeing surcharges as their own line item, rather than buried in a blended rate, is often where teams find the first concrete cost to attack. The point is to move from knowing what you spent to understanding why, which is what makes a spend number actionable rather than just reportable.
How does carrier performance scoring work?
Carrier scorecards rank your carriers on objective metrics pulled from real operational data: on-time pickup and delivery rates, tender acceptance rates, claims and exception frequency, and cost competitiveness by lane. Because on-time performance is built from actual tracking events rather than carrier self-reporting, the scores reflect what happened rather than what a carrier says happened. You can weight the metrics to match what matters most to your business and compare carriers head to head on a given lane. The scorecards give procurement an evidence base for awarding freight, renegotiating rates, or having a direct conversation with an underperforming carrier. Instead of an argument based on anecdotes, you bring a documented record, which changes both the tone and the outcome of carrier reviews and annual bids.
Can I export data to my BI tools?
Yes. Open export is a core design principle, so your data stays yours. You can pull CSV or Excel files on demand, schedule automated data feeds, and connect the API to pipe clean freight data directly into your BI warehouse or finance systems. That means the analytics module does not have to be the final destination for every number; it can be the clean, structured source that feeds a broader executive dashboard your company already runs. Keeping export open avoids the common trap of a tool that shows you data but will not let you get it out. During onboarding we help configure the export or feed so the data lands in the shape your BI stack expects, which keeps the numbers consistent from the platform through to the boardroom.
Is this different from my accounting or ERP reports?
Yes, they answer different questions. Accounting and ERP reports tell you what you paid and how it hits the general ledger. Freight analytics tell you why freight costs what it does and how carriers and lanes are performing operationally: transit times, on-time rates, accessorial drivers, and lane-level cost trends that a financial system does not capture. The two are complementary. Atlas TMS can feed clean, structured freight cost data back to your ERP so the ledger is accurate, while giving operations the transportation-specific analytics finance systems were never built to provide. Most teams find that the ERP tells them the freight bill went up while the analytics module tells them which lane, which accessorial, and which carrier caused it, which is the difference between noticing a problem and fixing it.
Do I need a data analyst to use it?
No. The module is built so operations and finance users get answers without SQL or a dedicated analyst. Standard dashboards cover the recurring questions, and the report builder uses drag-and-drop fields and filters rather than code, so a manager can assemble a custom cut on their own. Role-based views mean each person opens the platform to the metrics relevant to their job rather than a blank canvas. That said, if you do have analysts, open export and the API let them pull data into their own tools for deeper work. The design intent is to remove the bottleneck where every freight question waits on one overloaded analyst, so most answers are self-service and the analyst's time goes to genuinely complex analysis rather than routine report pulls.
Can reports be scheduled and sent automatically?
Yes. Any saved report or dashboard can be scheduled to run and deliver on a recurring basis, so the weekly on-time summary or the monthly spend report lands in the right inboxes without anyone remembering to build and send it. You set the cadence, the recipients, and the format, whether that is a PDF for a leadership review or a data file for a downstream system. Scheduled delivery is what turns reporting from a recurring chore into background infrastructure: the numbers arrive on time, in the same shape, every period. This is especially useful for standing operational reviews and finance close, where the same report is needed on the same day each cycle. Automating it removes both the manual effort and the risk that a busy week means the report simply does not go out.
How is the analytics data secured?
Analytics data is encrypted in transit and at rest, and role-based access controls govern who can see which dashboards, business units, and cost figures. A regional lane manager sees their region, finance sees the full spend picture, and a partner sees only what you grant them. Every sign-in and data pull is recorded, single sign-on ties access to your central identity provider, and the environment itself sits in audited, tightly restricted hosting. Because freight rate and spend data are commercially sensitive, they are treated as such and kept inside a controlled boundary rather than emailed around as spreadsheets that anyone can forward. During onboarding we configure access roles to match your organization, which both protects the data and keeps each user's view focused on the numbers that are actually relevant to their role.
Does it work if my freight is spread across many carriers?
Yes, and that is exactly where it earns its keep. When freight is spread across many carriers, each with its own portal and invoice format, getting one consistent view of spend and performance by hand is nearly impossible. The analytics module normalizes data from all of them into a single dataset, so spend, on-time rates, and lane cost are comparable across carriers regardless of how each one reports. That lets you rank carriers objectively, spot where you are over-relying on an expensive option, and consolidate volume where it makes sense. The more fragmented your carrier base, the more value there is in one place that makes them all comparable, because the fragmentation itself is usually hiding both cost and service problems that no single carrier's own reporting will ever show you.
How long does it take to get analytics live?
For customers already on Atlas TMS, standard dashboards can be live in one to two weeks because the shipment and cost data is already in the platform; the work is mapping cost and reference fields and configuring the metrics and views your teams need. Bringing in external sources like freight invoices or ERP cost centers, or building a set of custom scheduled reports, extends the timeline to three to five weeks depending on how many feeds are involved and how clean the data is. We typically publish the core dashboards first so teams get value quickly, then layer on custom reports and external feeds. The main variable is data quality: consistent lane codes, accessorial coding, and business-unit tags let the numbers roll up cleanly, so we front-load that mapping before going live.