

If at first you don’t succeed, GRI, GRI again!
- Weaker demand is proving challenging for carriers to gain control of the market.
- Blank sailings continue to improve vessel utilization, but still not enough for GRI’s to stick.
- Panama Canal’s low water level triggered strict weight restrictions on east coast bound vessels. Vessels are at near 100% utilization on a tonnage basis, but not on a TEU basis.
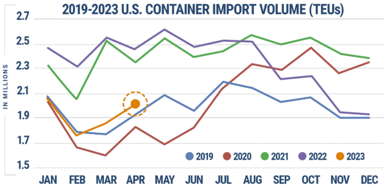
- U.S. ports imported 2,020,197 twenty-foot equivalent units of containerized cargo in April, Descartes said on Monday. That’s down 18% from a year ago, when American importers were frantically shipping in cargo. But it’s up 9% from March and 5% from April 2019, pre-COVID.
BOTTOM LINE:
Market is still weak and all eyes on a stronger 2nd half. GRI’s likely won’t stick until mid-June or early July for a proper peak.
In Other News…
- “So far we don’t see a strong move towards normalization. Some customers are getting to the end of destocking, but it’s not consistent,” Chief Executive Vincent Clerc said in an interview.
- Progress on the horizon for ILWU: Longshore labor and employers at the ports of Los Angeles and Long Beach have reached agreement on manning requirements for non-automated terminals, overcoming a major hurdle that could accelerate a deal on a new coastwide contract as negotiations near the one-year mark.
- FMC recognizes actions speak louder than words, beefing up enforcement program with new hire
- Shippers are choosing quality over race to the bottom pricing in trucking. The wise shipper wants options and recognizes that rates without execution are useless.
- Going Green: Cost of carbon neutralization for logistics should be excluded from transportation budget and ultimately pushed to the consumer
Asia → North America
(Transpacific East Bound – TPEB)
Capacity: We aren’t seeing any drastic increases in demand on the eastbound trans-Pacific. The market saw continued softness in the week ending 5/12. Expect carriers to continue utilizing blank sailings to tighten market capacity and increase rates
Rates: We’re seeing the market soften a bit and a potential June 1 GRI reported at $1200/$1600 WC/EC is unlikely.
Overheard “carriers are throwing spaghetti at the wall to see what sticks!”
Bottom Line: Carriers still haven’t created market conditions that gives them back control of freight rates. Expect carriers to continue to slow ships down and use blank sailings to drive up utilization and rates.
Europe → North America
(Trans-Atlantic West Bound – TAWB)
Across both North American trade lanes, persistently low volumes and an unbalanced supply/demand balance continues to pose a significant hurdle for carriers.
Capacity: Increased capacity has taken hold of the market. Rates continue to weaken. Industry sources attributed the recent falling rates to overcapacity on the trade, as well as low demand for European goods.
Bottom Line: Rates continue to decline towards pre-pandemic levels on European trade. Perhaps as the Asian market begins to restart we’ll see volumes shift back in peak season. The chase the rate game will continue!
Souteast Asia → North America
Rates and capacity remain static.
Indian Subcontinent → North America
Capacity: Few blank sailings, limited disruptions, capacity is open.
Rates: Container freight rates from the Indian subcontinent to North America remained stable in the week ended May 12.
Bottom Line: Expect stable rates for the remainder of the month and most likely first half of June.
North American Port Rundown
West Coast
Los Angeles/Long Beach: Port of Los Angeles dwell times for local import cargo is 3.8 days, on-dock rail dwell is 4.3 days and import units on street is averaging at 5.5 / 6.5 days for 20 ft and 40+ ft containers respectively. Cargo container traffic slowed at the Port of Long Beach in April as consumers continued to limit purchases and shippers shuffled trade from the West Coast to seaports on the East and Gulf coasts.
Oakland: Average wait time of up to 2 days at Oakland Int’l Container Terminal (OICT) and 2 days at TraPac. Average import deliveries can take up to 4.7 / 3 days at TraPac and OICT respectively. As yard space becomes available, boxes from TraPac will move to accessible areas for delivering. Average gate turn times are 49 / 56 minutes for OICT and TraPac respectively.
Seattle/Tacoma: No vessel delays. Containers coming off the vessel going into undeliverable areas for approximately 5-7 days. Equipment shortages easing.
Vancouver: Vessel berth congestion has improved, and vessels are no longer waiting to start operations. Daily rail productivity has been improved slightly. Rail dwells is around 8 days (avg.) and expected to getting better. Slight decrease in traffic as volumes have shifted to EC to avoid disruptions from potential strike.
Bottom Line: Low TPEB demand is further keeping West Coast port and rail congestion low. Low risk for WC strike as the current administration will immediately get involved.
East Coast
NY/NJ: 1 day waiting time expected for berth at Global Container Terminals Bayonne, Maher Terminals LLC and APM Terminals. No empty shut out situations at any of the terminals this week.
Average gate turn times are 41 / 65 minutes for single and double transactions respectively.
PANYNJ is undertaking projects this year to make it easier for truckers to navigate around the port and decrease waiting times.
Savannah: Maximum wait times of 3 days awaiting berth assignment. Savannah is currently the port with the largest number of ships waiting to berth on the EC, though backlog is getting smaller by about 3 ships per week. Average gate turn times are 38 / 58 minutes for single and double transactions respectively. $1.4 billion investment will increase the port’s annual capacity by 50% to 9 million TEUs, dwarfing other North American port investments planned through at least 2026.
Norfolk: Vessel waiting time is 1 – 2 days of delay for berthing. One crane is down, no operational impact expected.
Average gate turn times are 28 / 37 minutes for single and double transactions respectively.
Charleston: Waiting time for vessel berthing is up to 2 days.
Houston: Barbours Cut Container Terminal continues to experience berth congestion due to high yard utilization. Waiting time for vessel berthing is up to 3 days. Average gate turn times are 36 minutes at Barbours Cut Container Terminal.
Intermodal Rail
North American intermodal volume continues to lag in 2023, and it isn’t likely to rebound anytime soon.
In the year’s first quarter, total volume fell 8.6% compared to the level in the same quarter in 2022, according to Intermodal Association of North America (IANA) data. The number of domestic and international containers sank 5.8% and 8.8%, respectively, while trailer volume logged the biggest loss at 28.8%.
All seven high-density trade corridors IANA tracks — which collectively carry 60% of total North American intermodal volumes — posted declines. The south central-southwest corridor logged the biggest deficit at 19.2%.
The decline follows a trend that began last year. Total intermodal volume fell 3.6% year over year in Q4 2022, including a 4.2% drop domestic containers and a 29.7% plunge in trailers, according to IANA.
Domestic Freight Market
- Van Load-To-Truck (-17.7%)
- Flatbed Load-To-Truck (-18.1%)
- Reefer Load-To-Truck (-4.5%)
Questions? All you have to do is contact us.


